Consulting
Experience
Expertise in Finance, Accounting & IT

In many companies, SAP Analytics Cloud is the central entry point for reporting and analysis. Dashboards and ad-hoc analyses provide standardized key performance indicators (KPIs), defined data models, and a unified view of relevant business data.
At the same time, Microsoft Excel remains an integral part of daily work in many departments. Particularly in finance and controlling, users often continue to rely heavily on Excel for detailed analyses, reconciliations, and short-term evaluations.
Therefore, after a first glance at a key figure, further questions often arise immediately:
This is precisely where a media break often occurs in practice. Data is exported, filters and structures are manually reconstructed, and analytical contexts are lost between systems.
The "Open in Excel Add-In" function from the SAP Analytics Cloud Data Analyzer makes this transition significantly easier.
The starting point can be a simple ad-hoc analysis in the Data Analyzer, for example an evaluation by customers, regions and key figures with a pre-defined filter context.
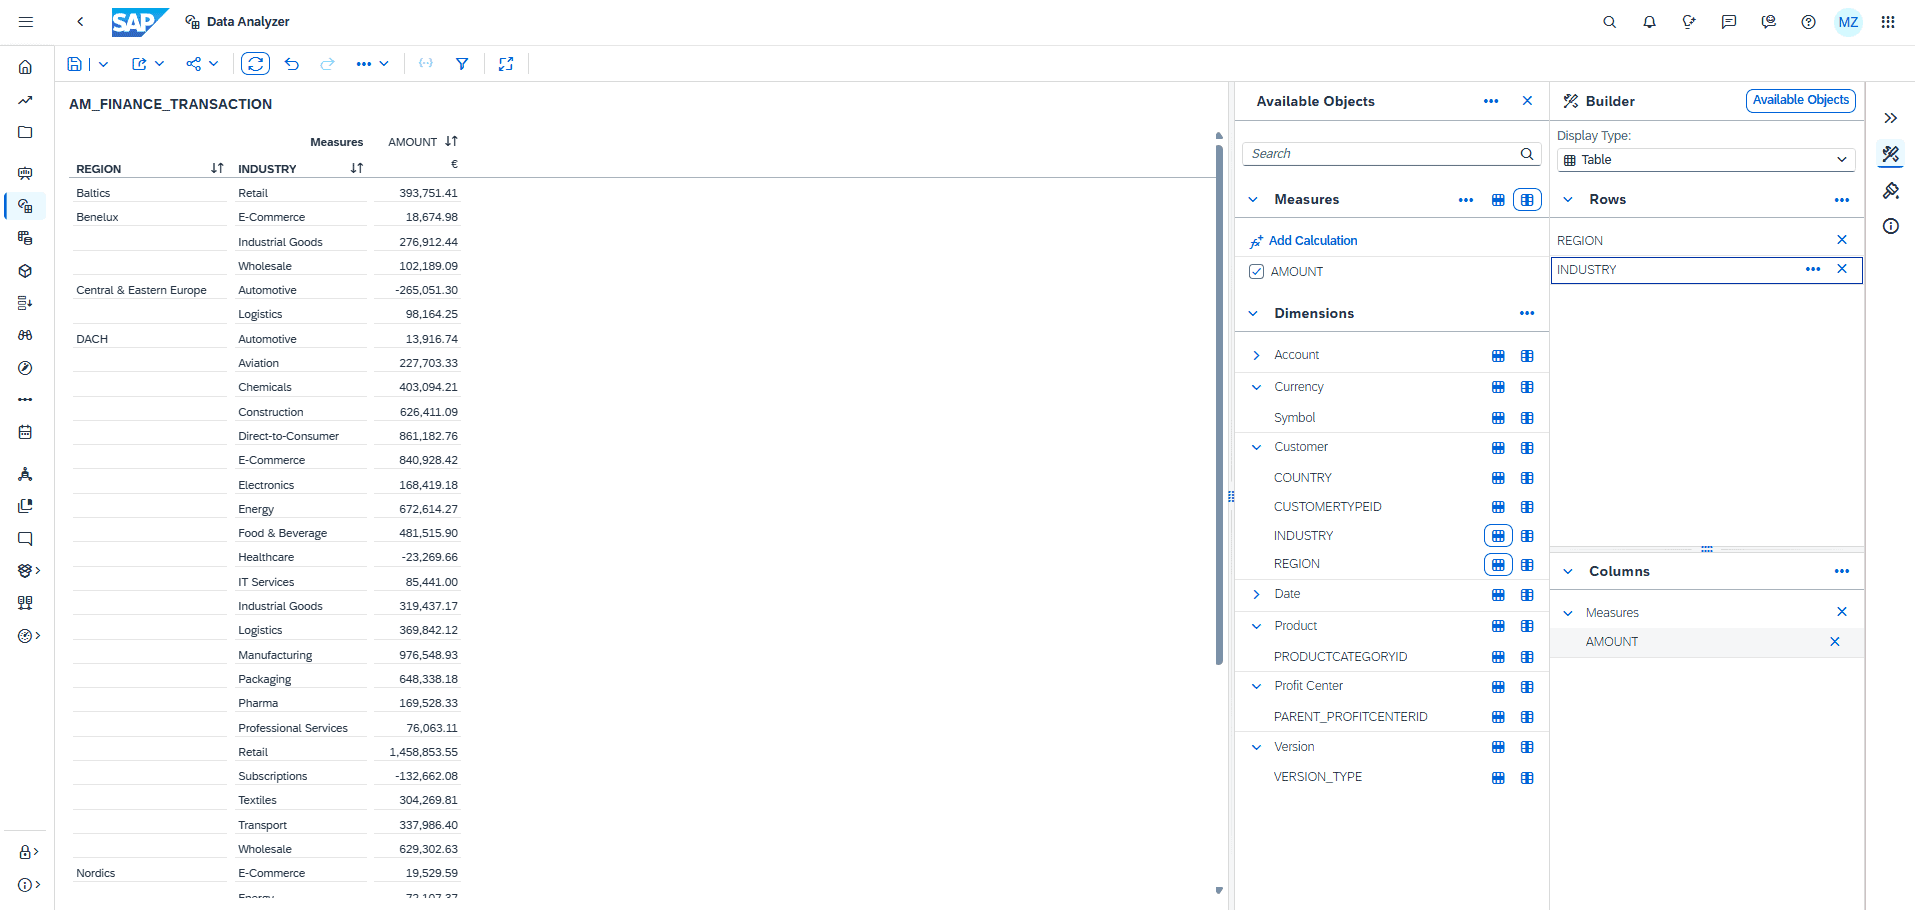
Figure 1: Comprehensive ad-hoc analysis by region and industry in the SAP Analytics Cloud Data Analyzer
About the Export menu This analysis can be performed directly in SAP Analytics Cloud Add-in for Microsoft Excel can be opened. This eliminates the traditional detour via a purely static export.
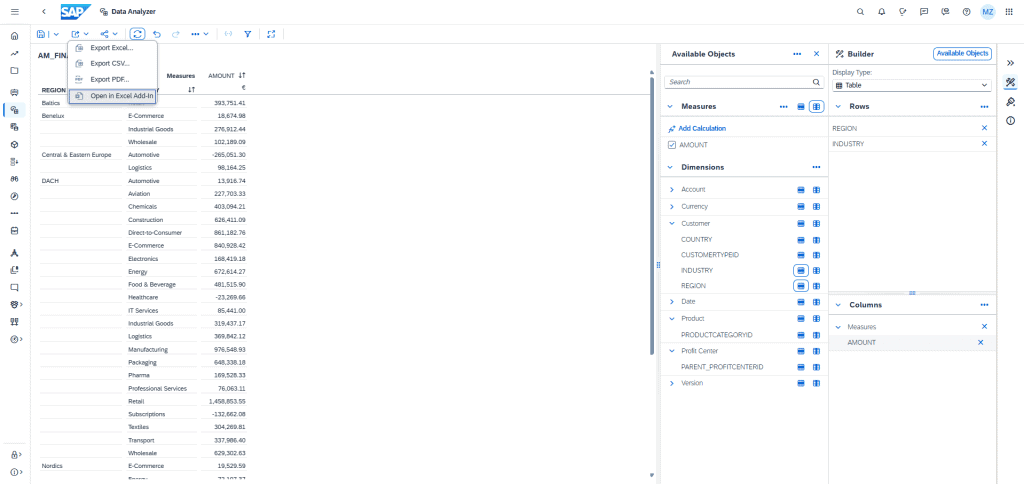
Figure 2: Direct transition via “Open in Excel Add-In” in the export menu of the Data Analyzer
This process doesn't just create one file. Analysis and navigation context Data from SAC is transferred to an Excel workbook. After logging in to SAC Excel Add-in The evaluation can be further analyzed in Excel.
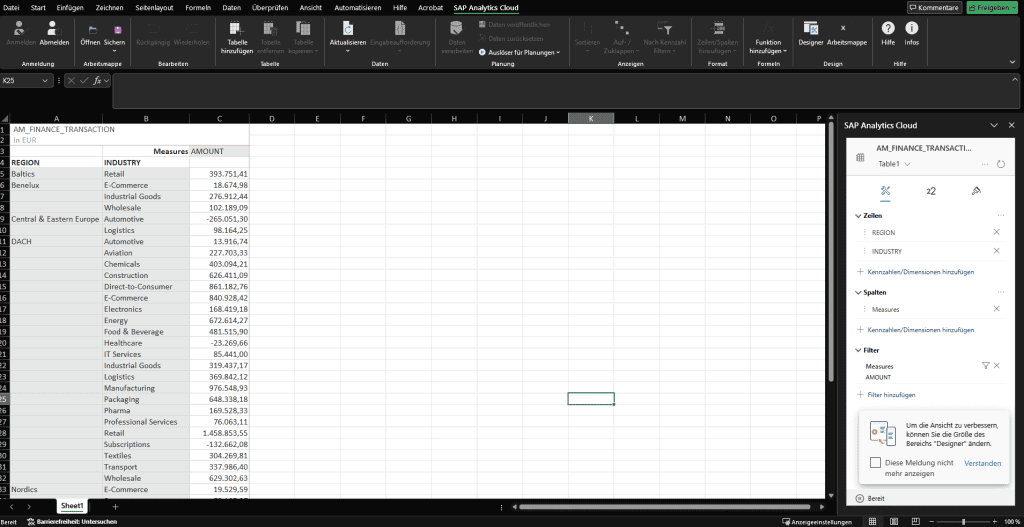
Figure 3: Data Analyzer evaluation imported into the SAP Analytics Cloud Add-in for Microsoft Excel
This is particularly relevant for departments that use SAP Analytics Cloud as their central reporting platform but still rely on Excel for detailed analyses, reconciliations, or individual evaluations. The added value lies not in replacing Excel, but rather in better integrating two established ways of working:
The SAC Excel add-in is relevant beyond reporting. In suitable planning scenarios, Excel can be used as a familiar interface for planning processes, for example, for data entry, adjustments, and working with SAC planning models.
This highlights an important point: modern analytics solutions don't necessarily have to completely replace existing ways of working. Often, the greatest benefits arise when centralized control, governance, and standardized reporting are combined with familiar tools within the business unit.
SAP Analytics Cloud remains the central platform for reporting, analysis, and planning. Excel is integrated where flexible, detailed work within the specialist department is still required.
Because reporting doesn't always end at the dashboard. Often, that's where the next analysis question begins.